Intro to R Part 1:
Getting Started

Andy
Lyons
October 11, 2022
https://ucanr-igis.github.io/IntroR_Oct22/

About Me…

About You
Number of registrants: 89
Familiarity with R

Email domain

Location
Goal
Move in the direction of becoming functional with R!!
Learning Strategy
1) Understand foundational terms and concepts
2) Hands-on practice
3) Discover RStudio’s bells and whistles
4) Learn how to get help
Today’s Focus
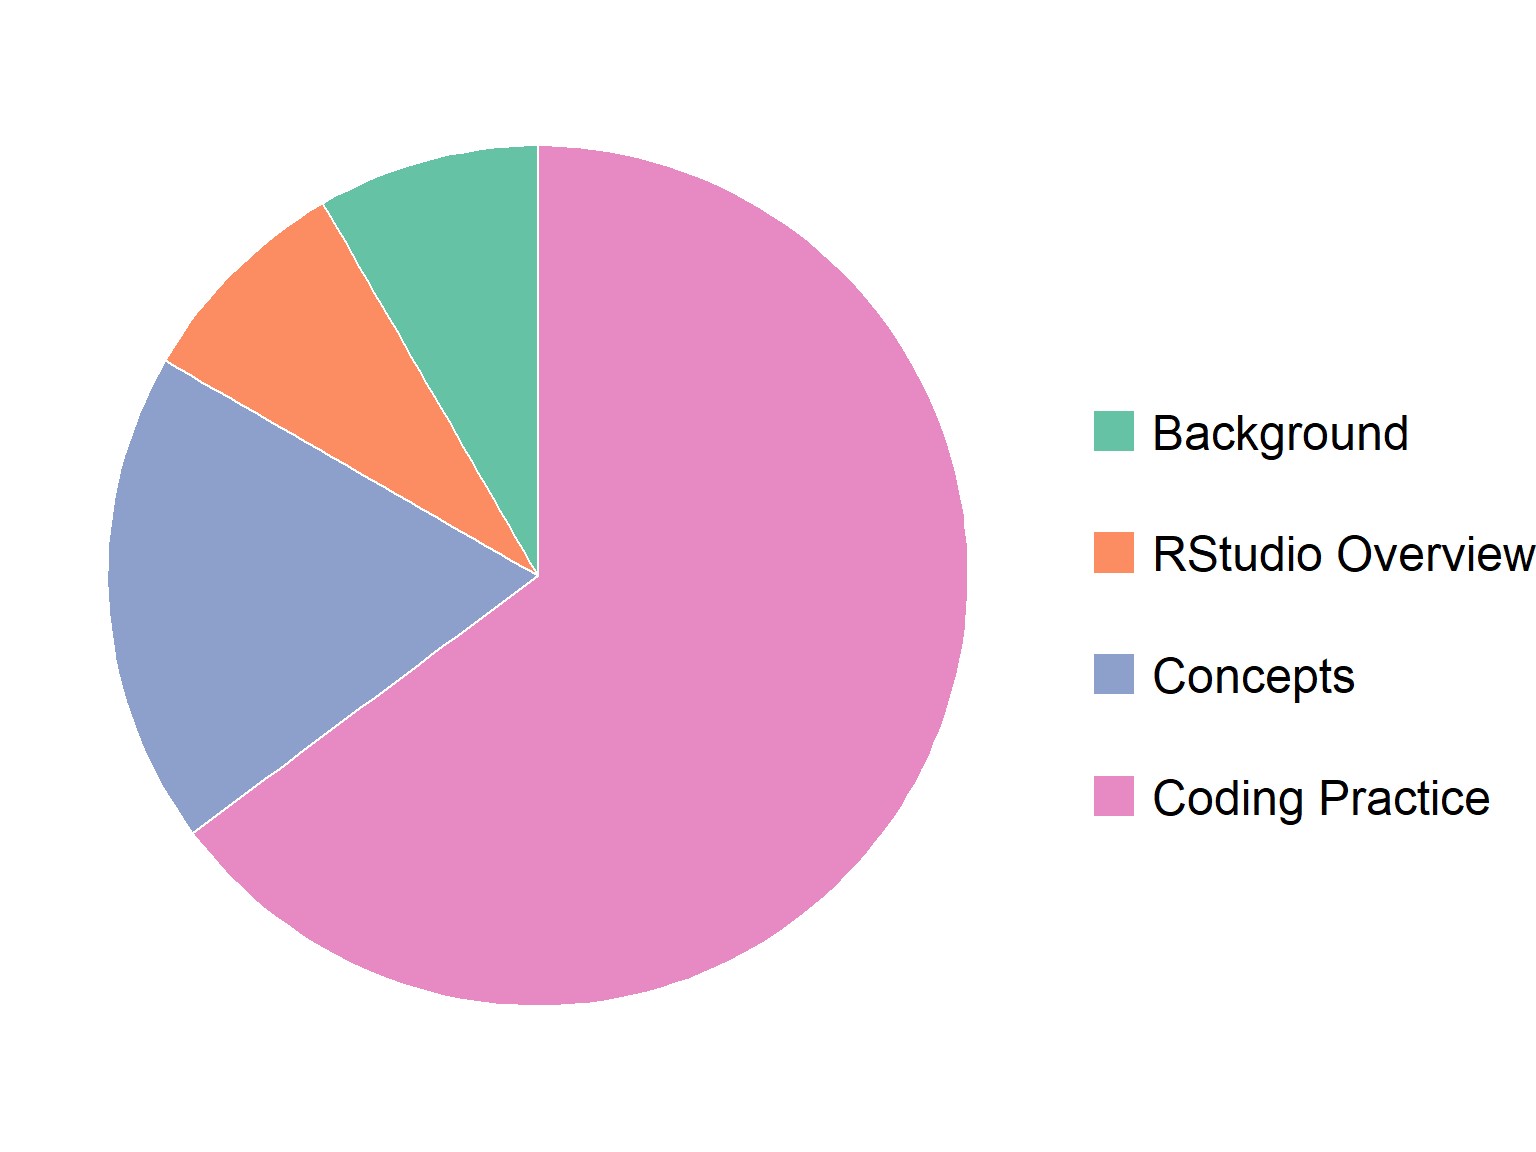
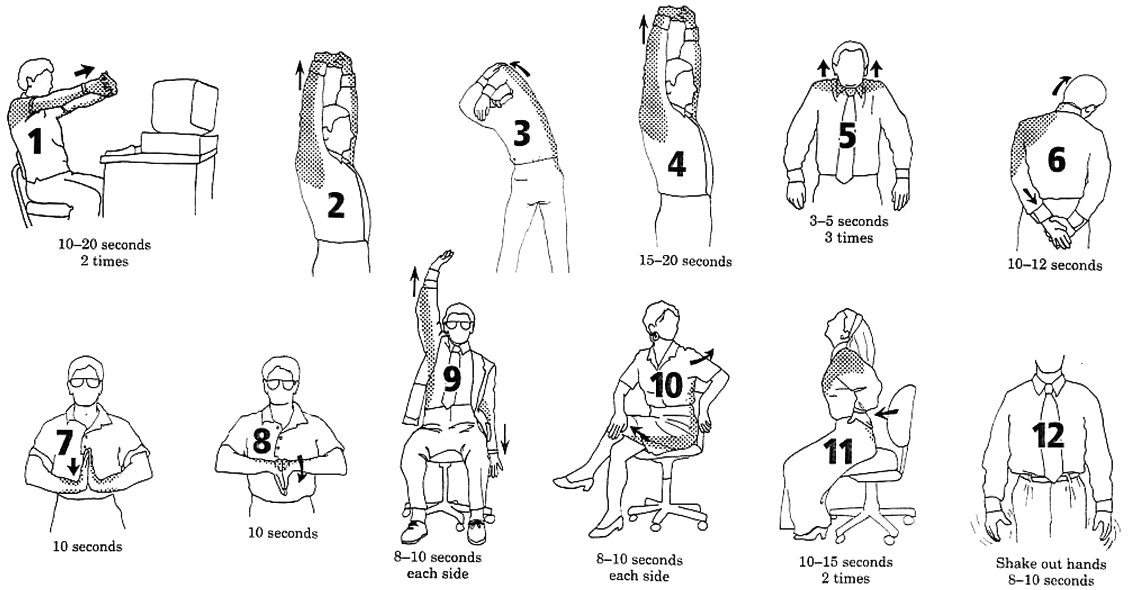
Learning Tips
1) Watch now, practice later
2) Review what we cover within 24 hours
Workshop Series
|
Date
|
Session
|
Oct. 11, 2022
3:30p -
5:00p
|
Part 1. Getting Started
|
Oct 12, 2022
3:30p -
5:00p
|
Part 2. Packages, Piping, and Importing Data
|
Oct 14, 2022
10:30a -
12:00p
|
Part III. Data Wrangling
|
See also Getting Started
with R resources.
R and RStudio
Why is R So Popular?
It’s free!
Huge user community (especially academics)
Thousands of add-ons (packages) that extend its
capabilities
Particularly strong in plotting and reporting
Once you get over the initial hump, can work very
efficiently
Makes it easy to get your code “out there”
Solid overall programming language

- a programming language to write scripts
- software (“environment”) that interprets scripts written in R
- inspired by ‘S’ (1976), first beta version ~2000
- lots of
user-contributed packages:
- CRAN: >22,000
- Bioconductor: >2,000
- R-Forge: >2,000
- GitHub: >85,400

- a very popular tool (IDE) to work with both R software and R
scripts
- Version 1.0 came out in late 2016
- RStudio needs R to run, but you can use R without RStudio
- RStudio Cloud -
run RStudio through a browser

- online version of RStudio
- requires an account (free account gets you 15 hrs / month)
- 98% same as RStudio Desktop
- have to upload your data to the cloud
- everything gets saved between sessions
- workspaces and projects can be shared with collaborators
Exercise 1: RStudio Exploration and Basic Commands
Exercise 1 Topics
- Using R like a fancy calculator
- Order of operations
- Comparison operators
- Saving the results of expressions to variable
- Rules for naming variables
RStudio Cloud project for this workshop:
https://rstudio.cloud/content/4701501
After it opens:

Break!
Exercise Review
Key vocabulary terms are in italic.
When you enter an expression at the console, R
will evaluate the expression, and print the results at
the console.
If you enter an incomplete expression, R will prompt you
to finish the job by showing a ‘+’ symbol in the console
You can save the results of an expression to an
object (variable) using an assignment operator
=
<-
R objects can be named almost anything (but no spaces or
hyphens please)
R is case sensitive about
everything
Once defined, R objects can be used in subsequent
expressions
R objects can be updated (assigned a new value)
R objects are only saved in memory, and will disappear
when you close RStudio
Comparison operators return TRUE or FALSE (aka Logical
values)
- R has a few built-in constants, which are like objects but
you don’t have to define them
Naming Objects
The rules for naming objects are pretty flexible. You can use
numbers, letters, and most special characters.
A few rules to take note of:
- Can’t start with a number: 3pieces
- Hyphens and spaces not allowed: first name,
last-name
- Don’t use the name of a built-in function, constant, or keyword:
c, pi
Naming Styles
There are a handful of popular naming styles. Pick one that you like, and be
consistent!
|
Style
|
Example
|
|
alllowercase
|
adjustcolor
|
|
period.separated
|
shoe.size
|
|
underscore_separated (aka snake case)
|
numeric_version
|
|
lowerCamelCase
|
addTaskCallback
|
|
UpperCamelCase
|
SignatureMethod
|
Data Types
All variables have a class or data type, which you can view using
class().
num_plots = 10
class(num_plots)
## [1] "numeric"
Other common data types:
- character
- factor
- date
- data frame, tibble
- matrix
- list
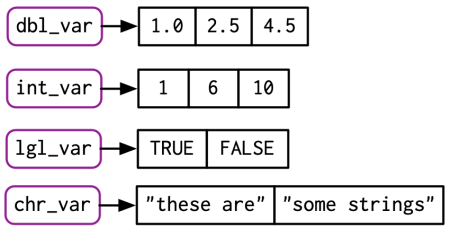
Vectors
vectors are R objects that contain multiple
values of the same class.
Example:
## [1] 4 5 6 7 8 9 10 11 12
More examples:
Creating Vectors
In general, you need to use a function or
operator to create a vector.
Sequence of numbers with the : operator:
## [1] 1 2 3 4 5 6 7 8 9 10
Repeat function:
## [1] "Quercus lobata" "Quercus lobata" "Quercus lobata" "Quercus lobata"
## [5] "Quercus lobata"
Combine elements of the same class with c():
yn <- c(TRUE, FALSE, TRUE)
yn
## [1] TRUE FALSE TRUE
Some built-in constants are also vectors:
##  [1] "A" "B" "C" "D" "E" "F" "G" "H" "I" "J" "K" "L" "M" "N" "O" "P" "Q" "R" "S"
## [20] "T" "U" "V" "W" "X" "Y" "Z"
##  [1] "AL" "AK" "AZ" "AR" "CA" "CO" "CT" "DE" "FL" "GA" "HI" "ID" "IL" "IN" "IA"
## [16] "KS" "KY" "LA" "ME" "MD" "MA" "MI" "MN" "MS" "MO" "MT" "NE" "NV" "NH" "NJ"
## [31] "NM" "NY" "NC" "ND" "OH" "OK" "OR" "PA" "RI" "SC" "SD" "TN" "TX" "UT" "VT"
## [46] "VA" "WA" "WV" "WI" "WY"
##  [1] "January"   "February"  "March"     "April"     "May"       "June"
##  [7] "July"      "August"    "September" "October"   "November"  "December"
Random number functions:
##  [1] 0.24034637 0.36129627 0.31932912 0.36040619 0.10315605 0.66583121
##  [7] 0.15364120 0.02328397 0.62662163 0.46527359 0.09406921 0.43920132
## [13] 0.39845071 0.69523229 0.77945612 0.42430562 0.57525211 0.78171852
## [19] 0.29296575 0.64298070
##  [1] -0.2147803  0.3774138  0.6490794 -0.3913319 -0.3312433  0.7447508
##  [7]  0.5856689  0.9039691 -1.0058598  0.3497485  2.1102232 -0.8948942
## [13] -0.9326346 -1.7975214 -0.4048500 -0.9293515  0.4510814 -1.2083119
## [19]  0.3961602 -0.7003346
## [1] "Jan" "Feb" "Apr"
How Vectors Behave
Vectorized operations
Many R functions and math operators are vectorized
(i.e., operate on each individual element).
Examples
First we create two numeric vectors:
## [1] 0 1 2 3 4
## [1] 11 12 13 14 15
Are sin() & cos() vectorized?
## [1] 0.0000000 0.8414710 0.9092974 0.1411200 -0.7568025
## [1] 1.0000000 0.5403023 -0.4161468 -0.9899925 -0.6536436
Addition (and all math functions) is vectorized:
## [1] 1 2 3 4 5
## [1] 11 13 15 17 19
Aggregate functions
Functions that accept a vector and spit out a single value are
aggregate.
##  [1] 0.39271638 0.73787278 0.89058362 0.34175404 0.21611711 0.86796133
##  [7] 0.84449887 0.54382415 0.79583754 0.02044313 0.67371211 0.89399457
## [13] 0.50483813 0.81232642 0.53471147 0.60363816 0.18086160 0.78866131
## [19] 0.11792667 0.84987164
Most descriptive stats functions are aggregate:
## [1] 0.5806076
## [1] 0.6386751
## [1] 0.2826853
Other aggregate functions:
Subsetting Vectors
To extract a single element from a vector, use square bracket
notation. Inside the square brackets, put the index of the element(s)
you want.
Subset with indices

To return multiple elements, pass a vector of indices.
You can also use square brackets to extract elements in a different
order.
Subset with logicals
You can also insert a vector of Logical values (TRUE/FALSE) in the
brackets. R will return the corresponding element for the TRUE
values.
LETTERS[c(T,T,T,T,T,T,T,T,F,F,F,F,F,F,F,F,F,F,F,F,F,F,F,F,F,F)]
## [1] "A" "B" "C" "D" "E" "F" "G" "H"
Better still, use an expression that returns a vector of logical
values:
state.abb[ substr(state.abb, 1, 1) == "N" ]
## [1] "NE" "NV" "NH" "NJ" "NM" "NY" "NC" "ND"
Plotting Vectors
Base R has simple plotting functions you can use to view the
distribution of data.
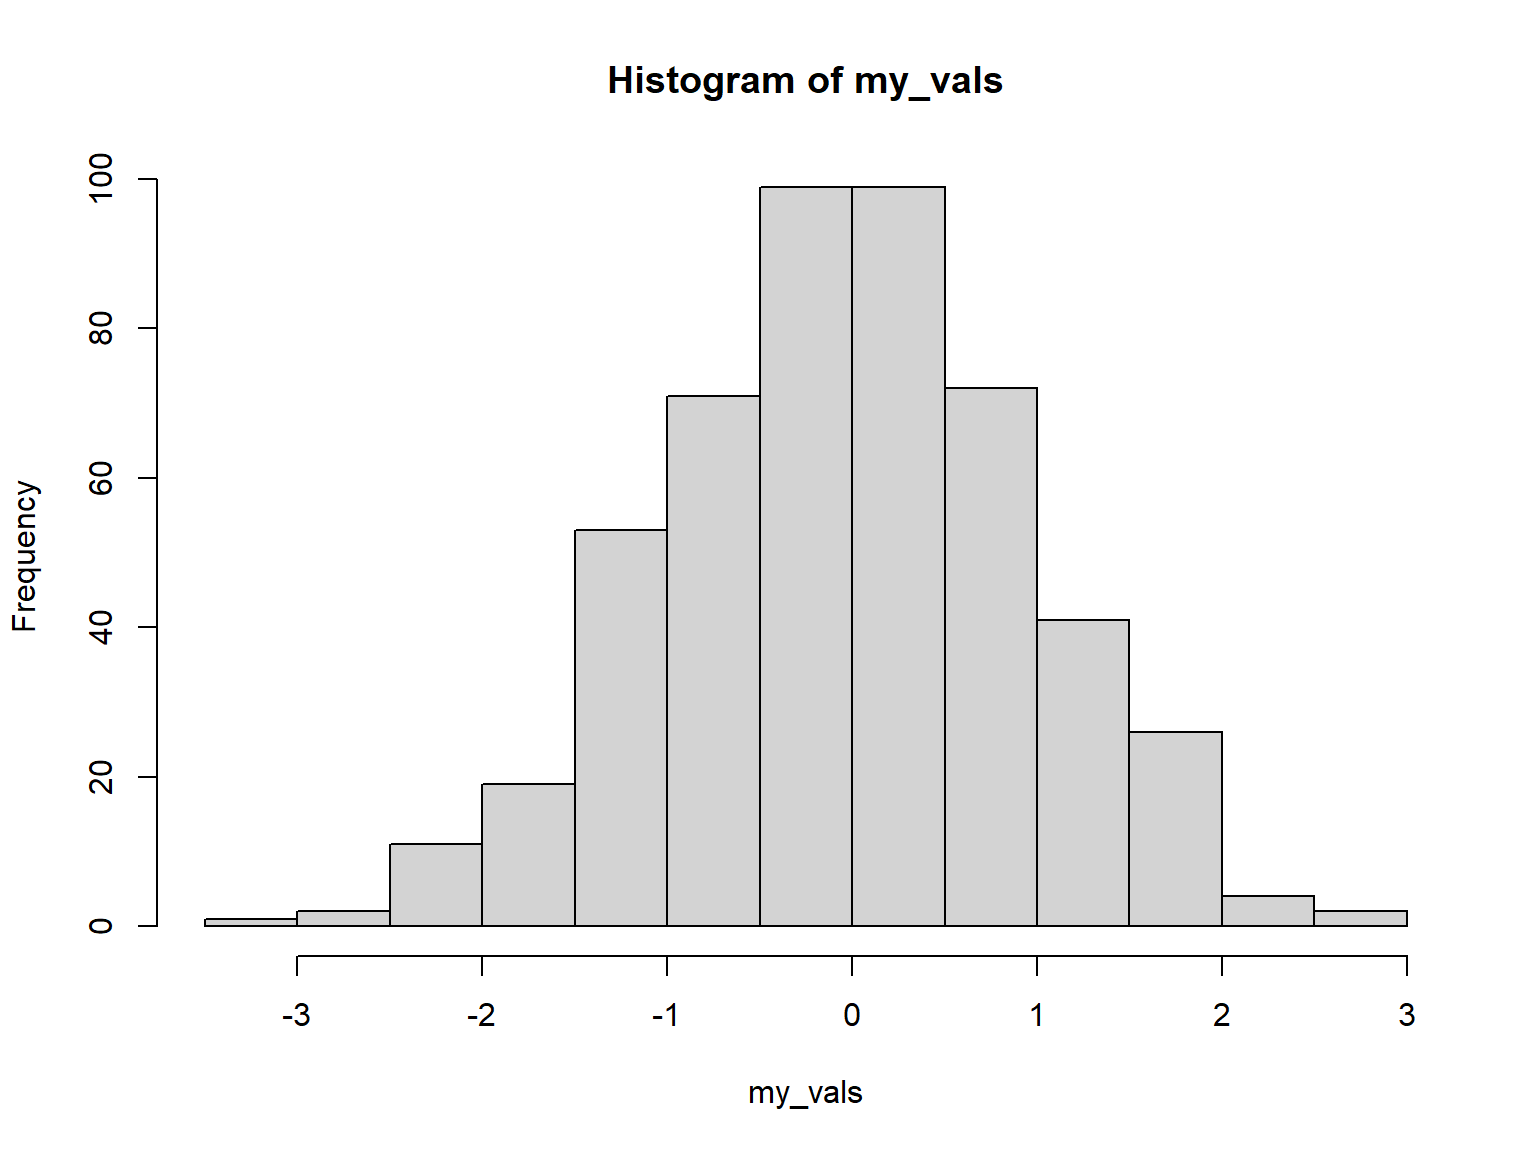
Histograms
To make a histogram, use hist():
my_vals = rnorm(500)
hist(my_vals)
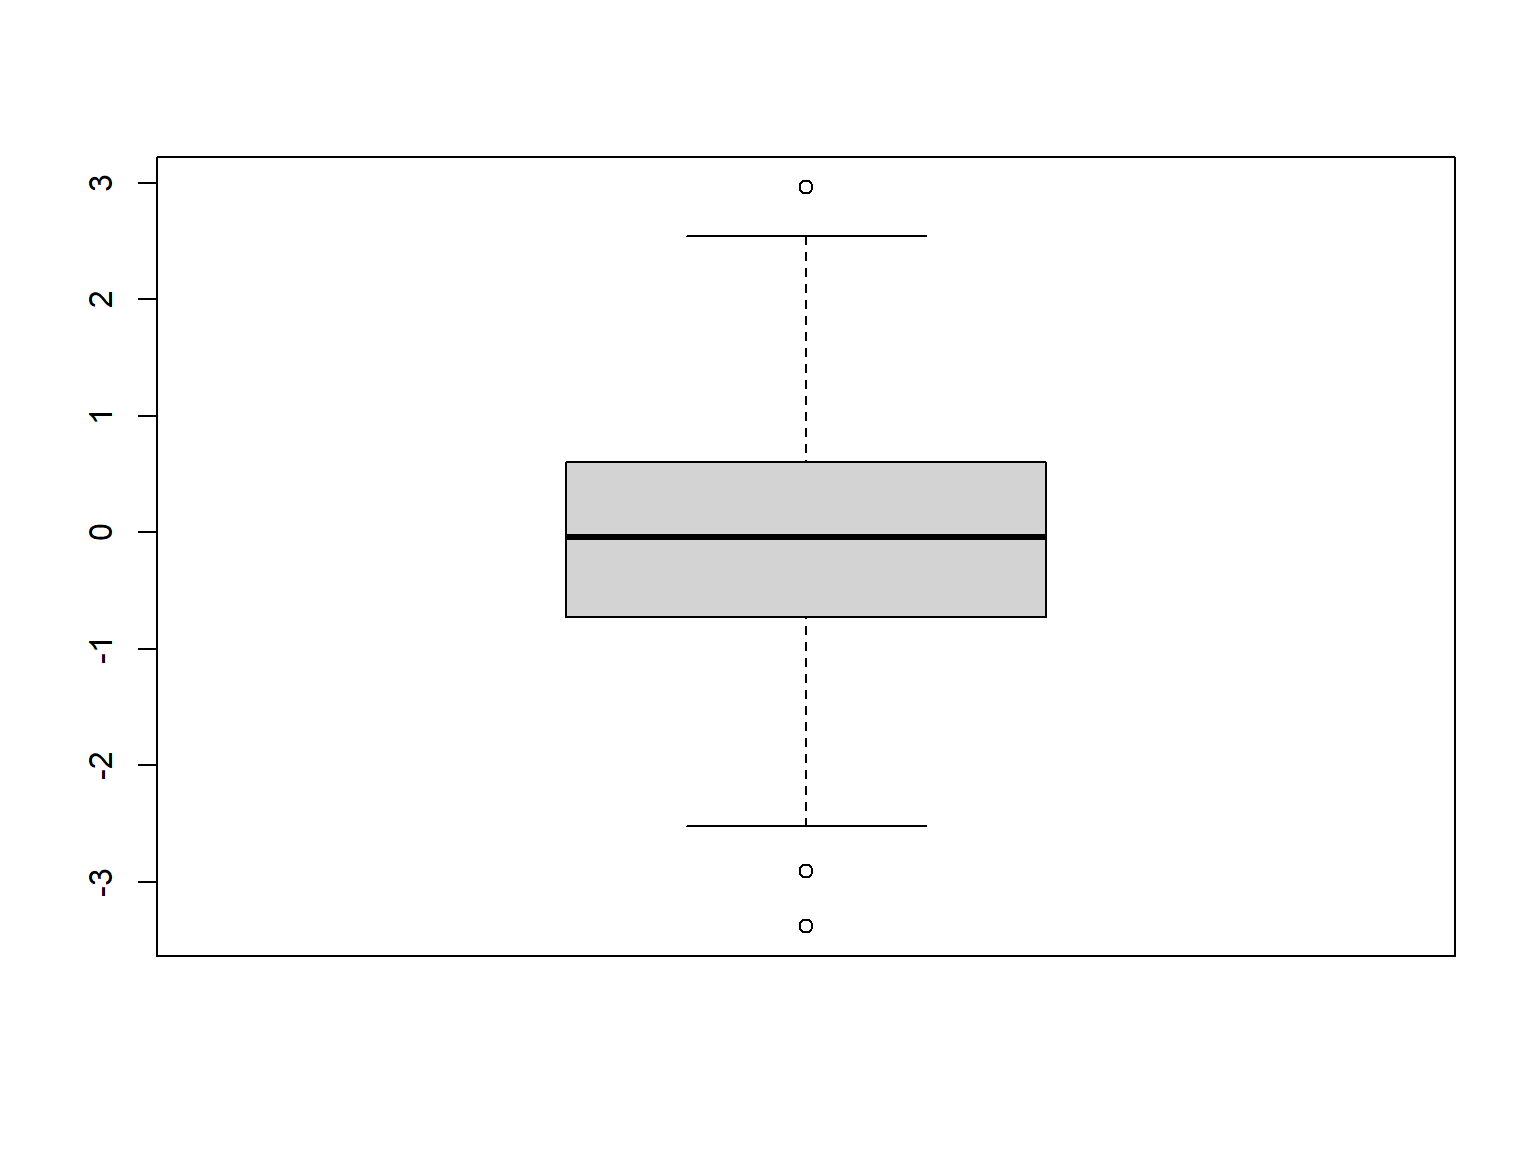
Box Plots
Prefer a box plot?
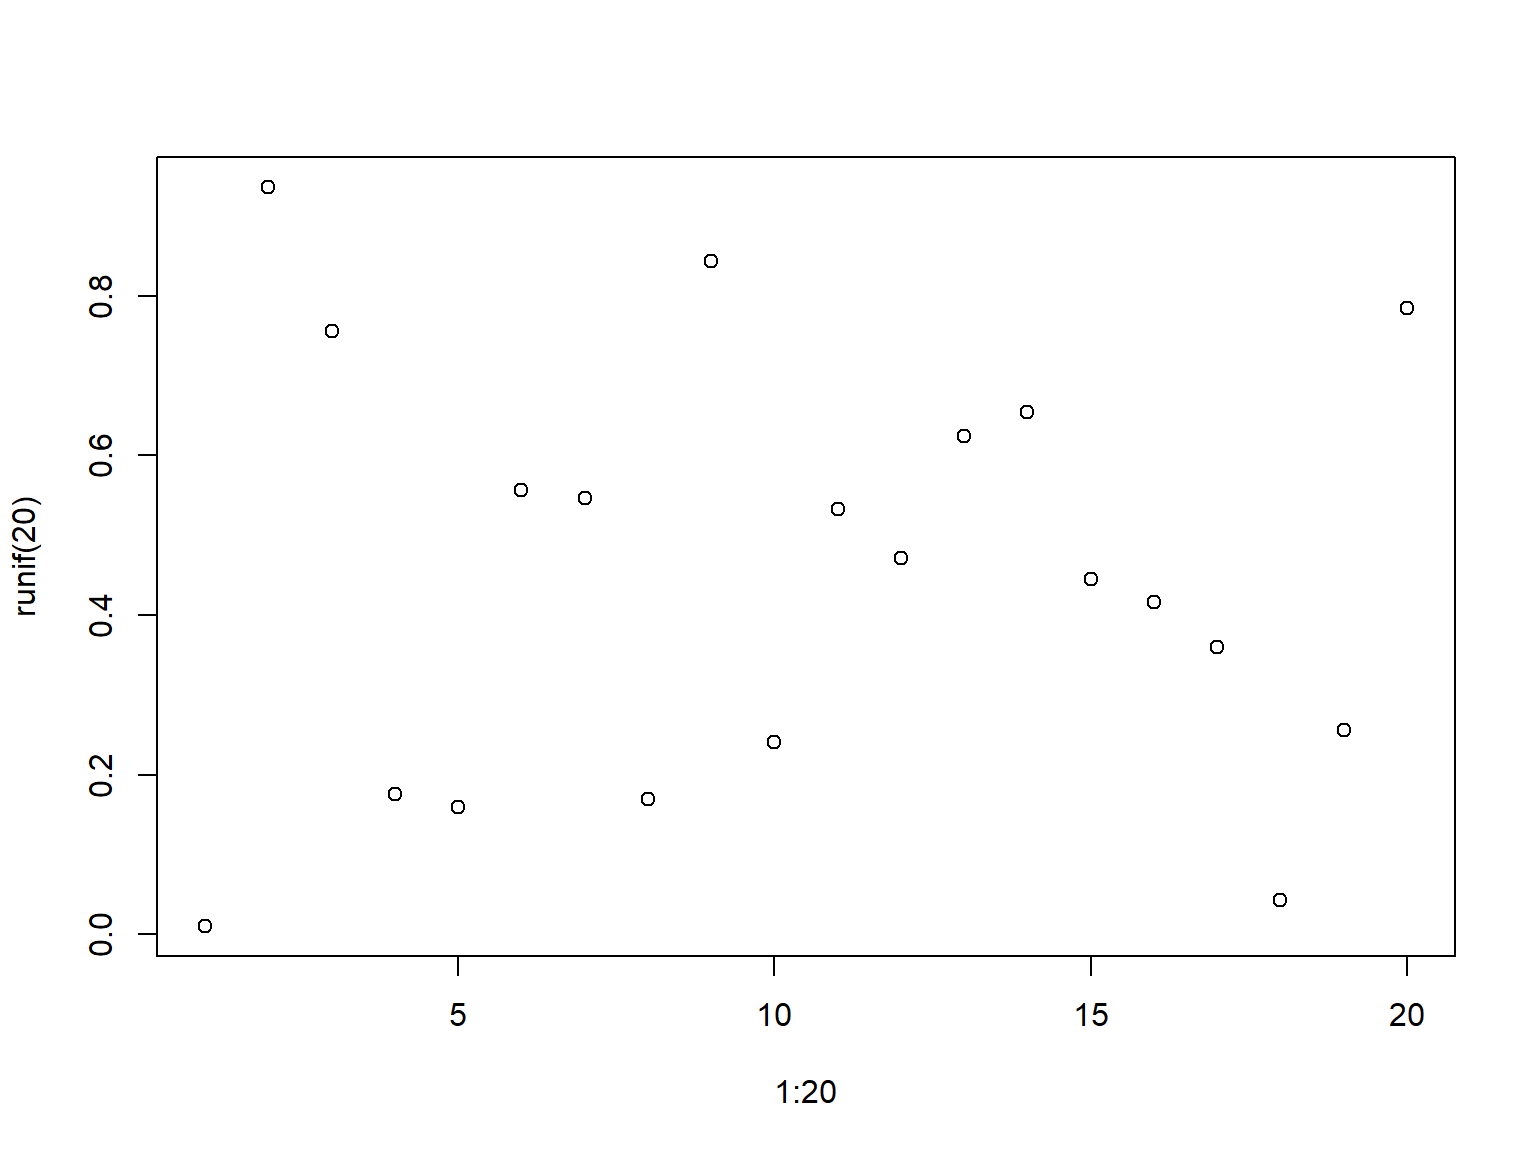
Scatter Plots
The versatile plot() can be used to make a simple
scatter plot:
plot(x = 1:20, y = runif(20))
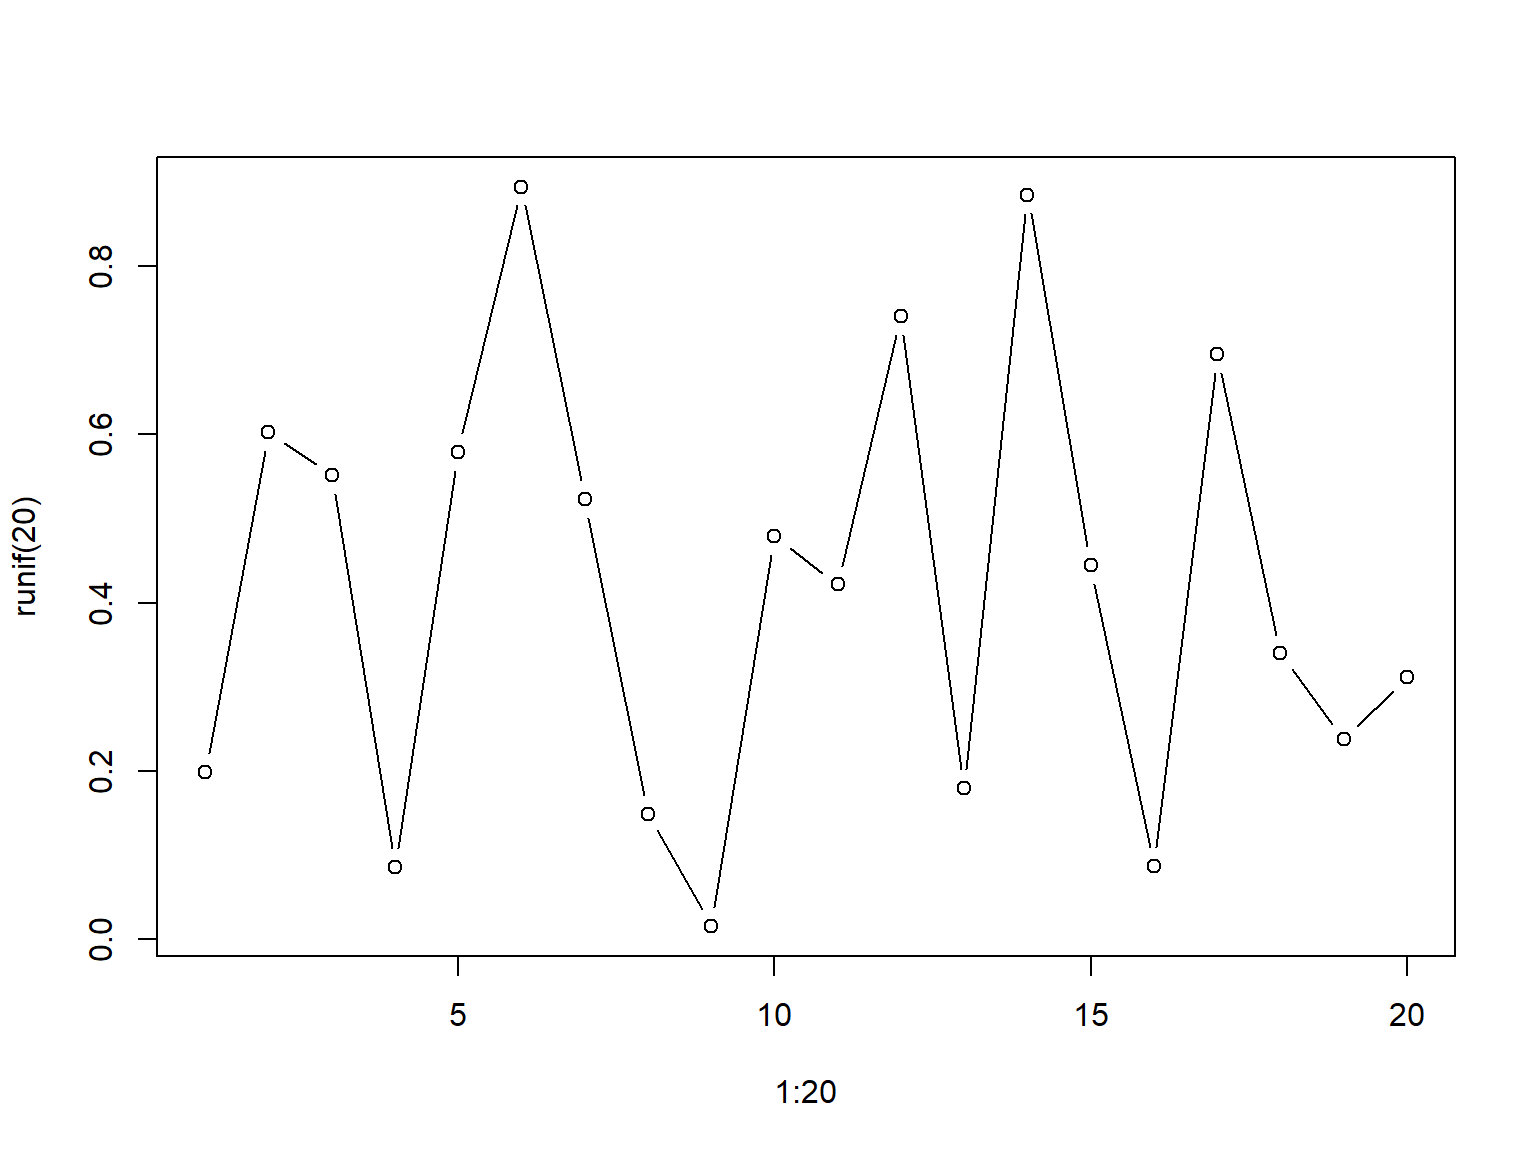
Line Plots
plot(x = 1:20, y = runif(20), type = "b")
Scripts
Top five advantages of using scripts over the console:
-
Easier to write (and fix!) your code
-
You can add comments to remind yourself what each command is doing
-
Reuse your own code
-
You can add loops and if-then statements later on
-
Tell your friends you’re a
coder!

Exercise 2: Working with Scripts and Vectors
Exercise 2 Topics
- Saving code in scripts
- Data types
- Vectors
Exercise 2 Review
vectors are R objects that contain multiple values of
the same class
Some functions that return
vectors:
c()
seq()
rnorm()
sample()
You can build vectors from scratch using:
c()
Functions and operators that operate on each element of a vector
and return another vector are said to be
vectorized
round(), abs()
+ - *
/
Functions that take multiple elements of a vector and spit out a
single value are said to be aggregate
functions
sum(), min(), mean(), max()
You can plot the distribution of numeric data using
plotting functions like:
hist(), boxplot(),
plot()
END!