Intro to R Part 4:
ggplot

![]()
Load Palmer Penguins data frame:
library(palmerpenguins)
head(penguins)
## # A tibble: 6 × 8
## species island bill_length_mm bill_depth_mm flipper_l…¹ body_…² sex year
## <fct> <fct> <dbl> <dbl> <int> <int> <fct> <int>
## 1 Adelie Torgersen 39.1 18.7 181 3750 male 2007
## 2 Adelie Torgersen 39.5 17.4 186 3800 fema… 2007
## 3 Adelie Torgersen 40.3 18 195 3250 fema… 2007
## 4 Adelie Torgersen NA NA NA NA <NA> 2007
## 5 Adelie Torgersen 36.7 19.3 193 3450 fema… 2007
## 6 Adelie Torgersen 39.3 20.6 190 3650 male 2007
## # … with abbreviated variable names ¹flipper_length_mm, ²body_mass_g
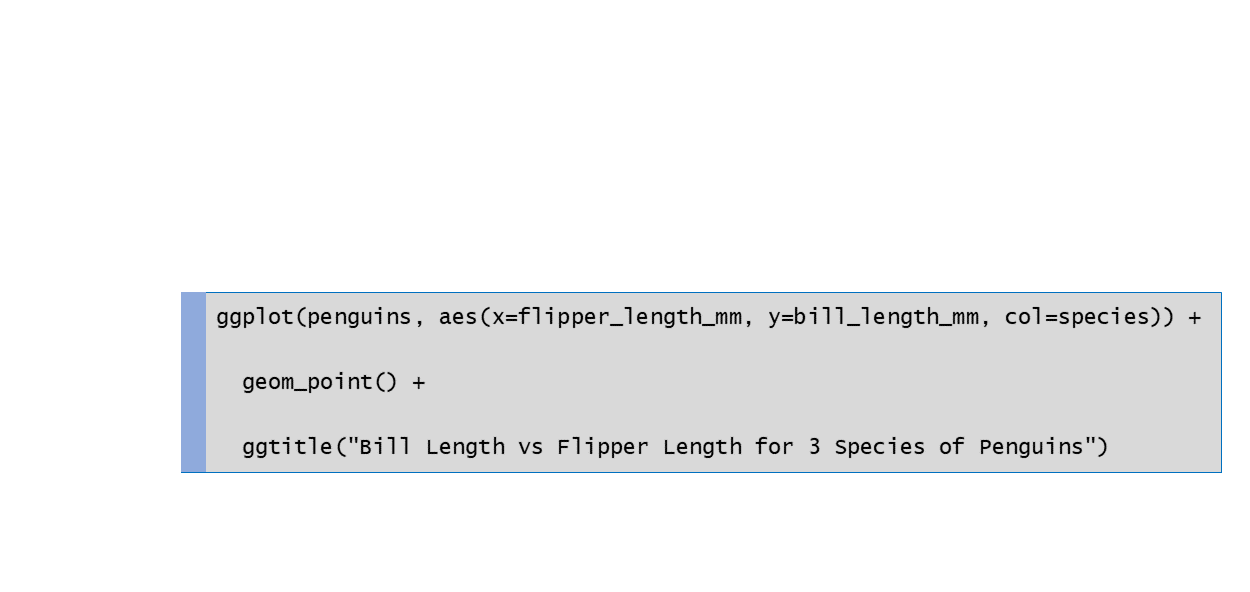
Use ggplot to make a scatter plot:
ggplot(penguins, aes(x = flipper_length_mm, y = bill_length_mm, color = species)) +
  geom_point() +
  ggtitle("Bill Length vs Flipper Length for 3 Species of Penguins")
## Warning: Removed 2 rows containing missing values (geom_point).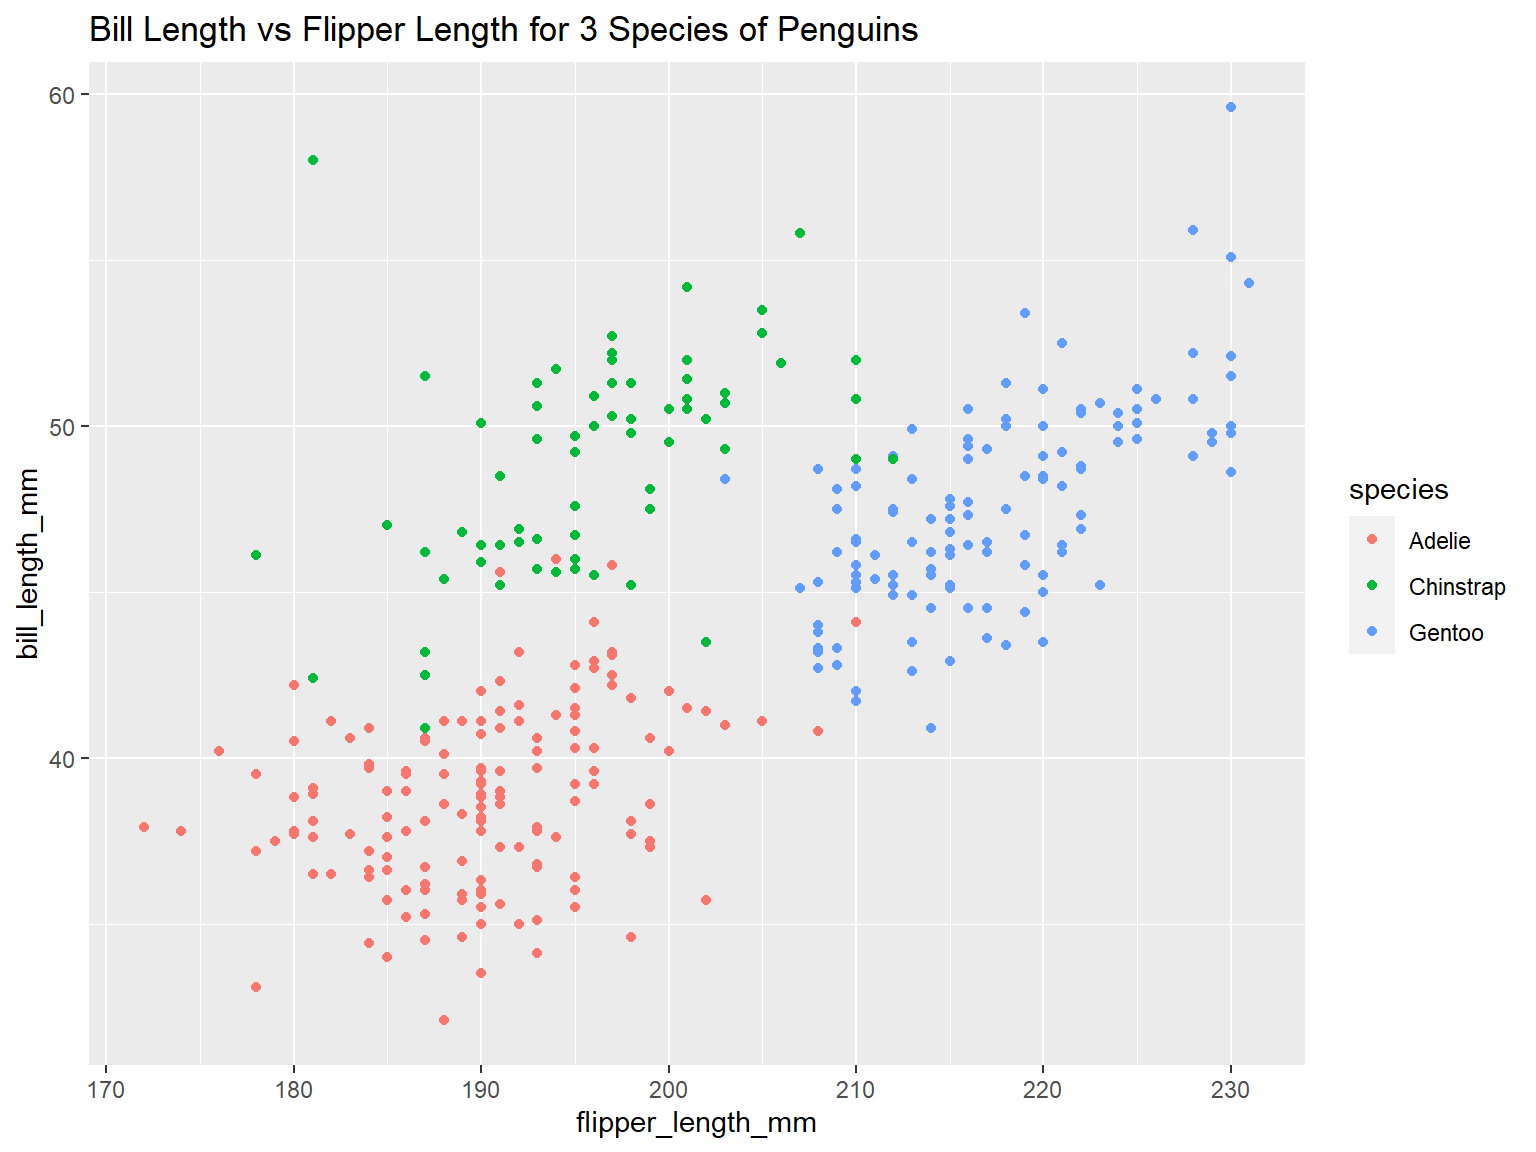
geom_xxxx() functions add layers
drawn from the bottom up
some common geoms:
geom_point(col = pop_size)
geom_point(col = “red”)
visual properties are inherited (from
aes())
each geom has default color palettes and legend settings
In the example below, note where geom_boxplot() gets its
visual properties:
aes()ggplot(penguins, aes(x = species, y = bill_length_mm)) +
geom_boxplot(color = "navy", fill = "yellow", size = 1.5)## Warning: Removed 2 rows containing non-finite values (stat_boxplot).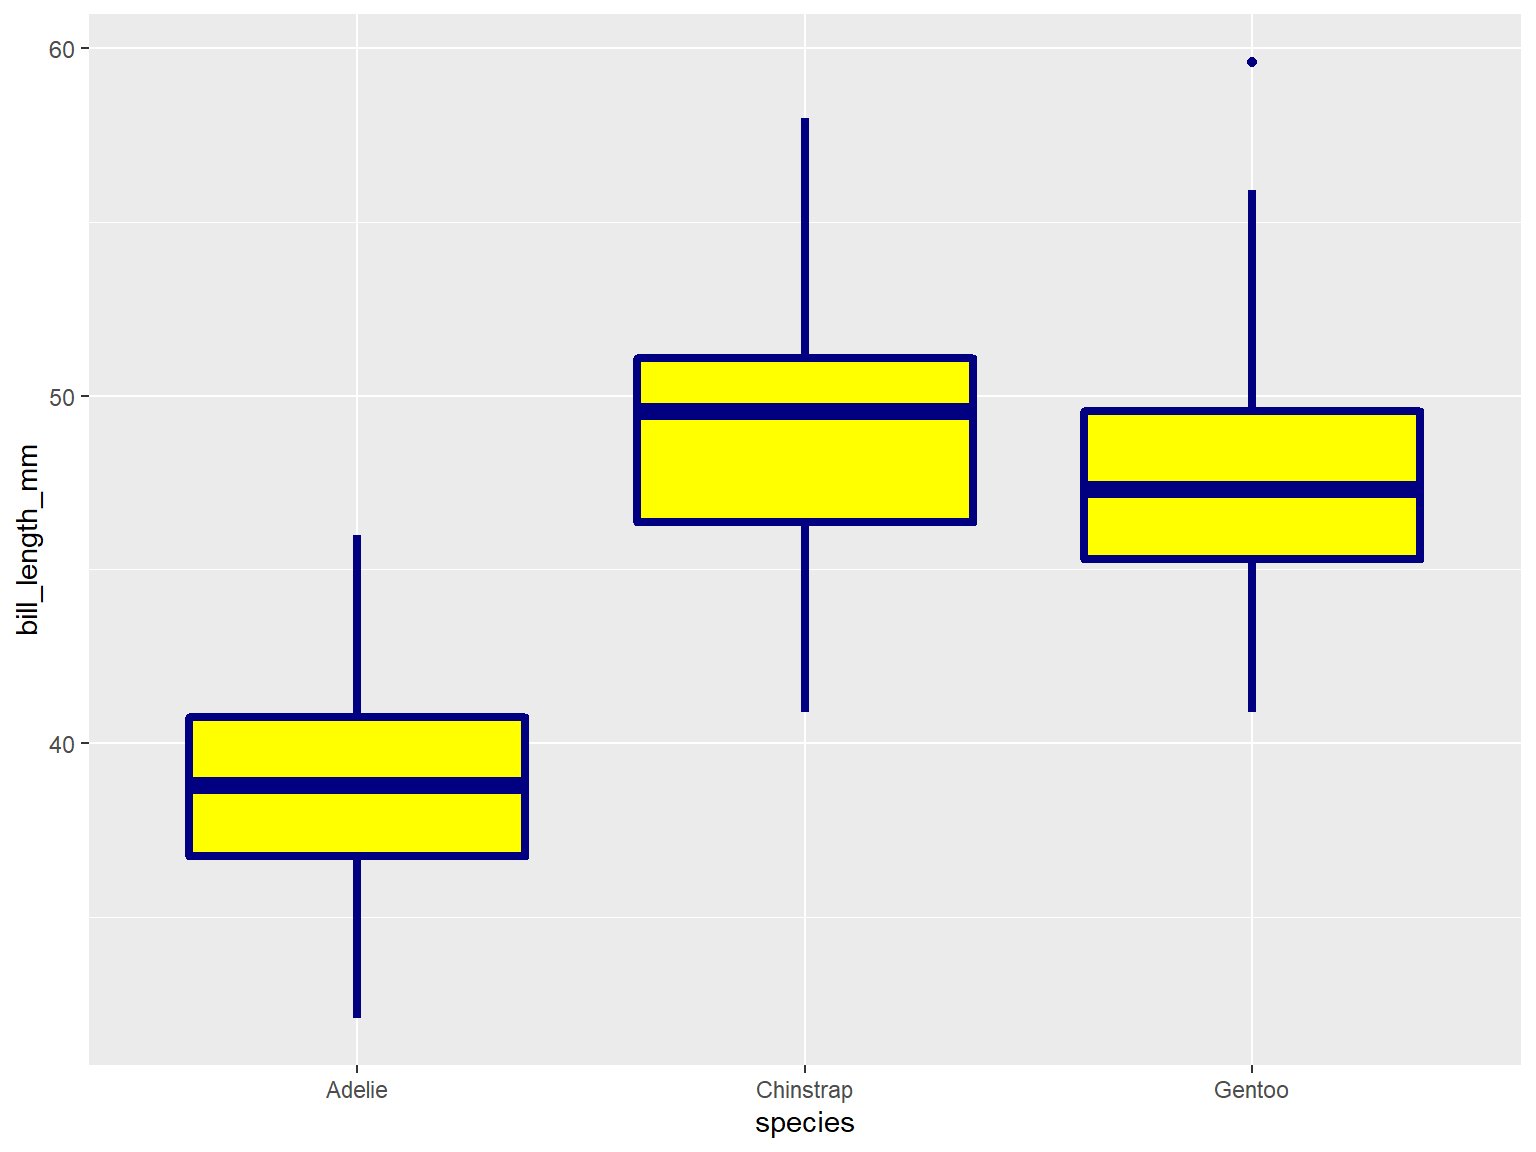
geom_xxxx() functions can also be used to add other
graphic elements:
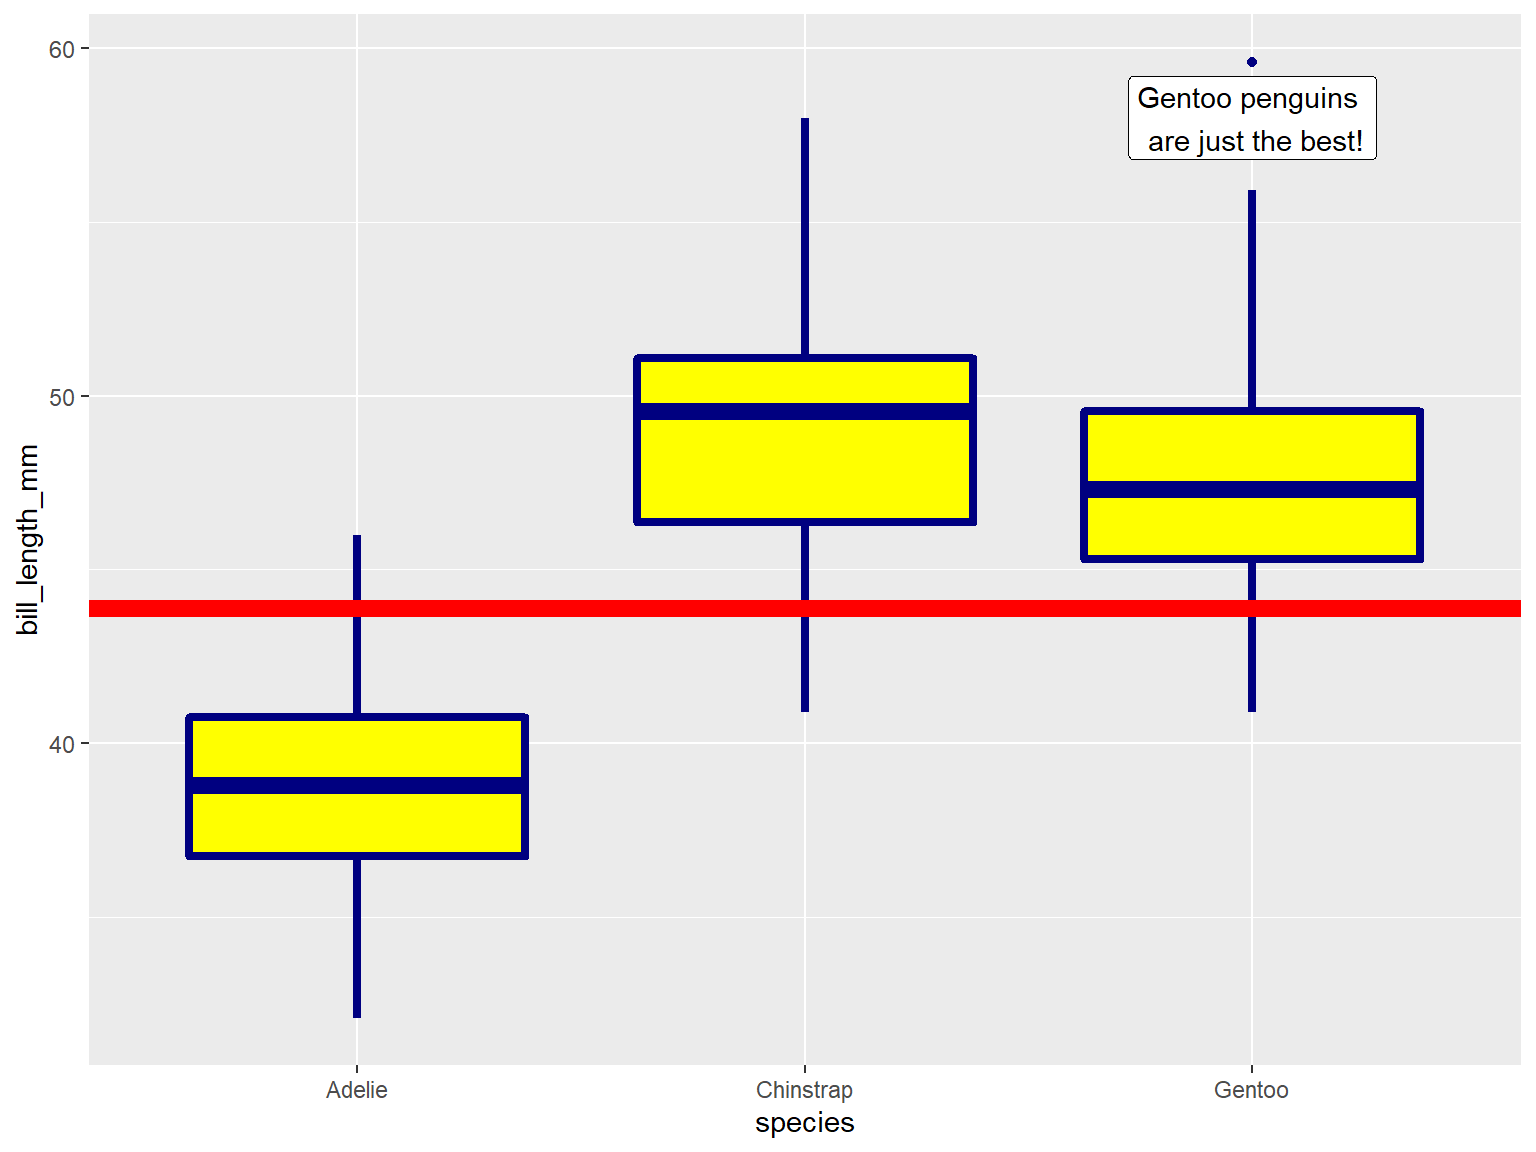
ggplot(penguins, aes(x = species, y = bill_length_mm)) +
geom_boxplot(color = "navy", fill = "yellow", size = 1.5) +
geom_hline(yintercept = 43.9, size=3, color="red") +
geom_label(x = 3, y = 58, label = "Gentoo penguins \n are just the best!")## Warning: Removed 2 rows containing non-finite values (stat_boxplot).