Working with Cal-Adapt Climate Data in R:
Rasters

Why Rasters?

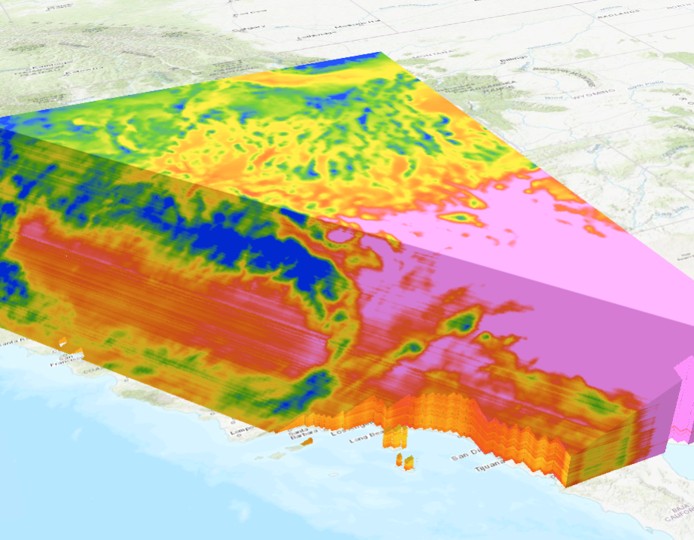
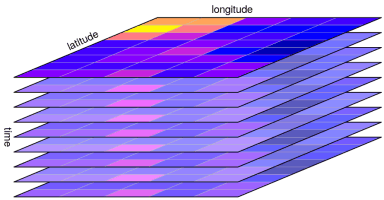
Climate data are inherently raster.

Rasters can cover large areas.

Download once, use many times.

Querying locations is easy.

There are many well-developed tools for
manipulating and analyzing raster data.

Challenges with Climate Rasters

Large file sizes.

Can wind up with one raster with many layers, and/or many rasters with one layer.

File format limitations (especially TIFs).

Typical spatial data headaches (CRS, resolution).

Challenge of analyzing multiple futures.

Downloading Rasters

Cal-Adapt website Cal-Adapt FTP caladapt-py caladaptR
Download rasters
Statewide
User area-of-interest
10 recommended GCMs
All 32 GCMs


https://ucanr-igis.github.io/caladapt-py/


Getting Rasters with caladaptR

Overview

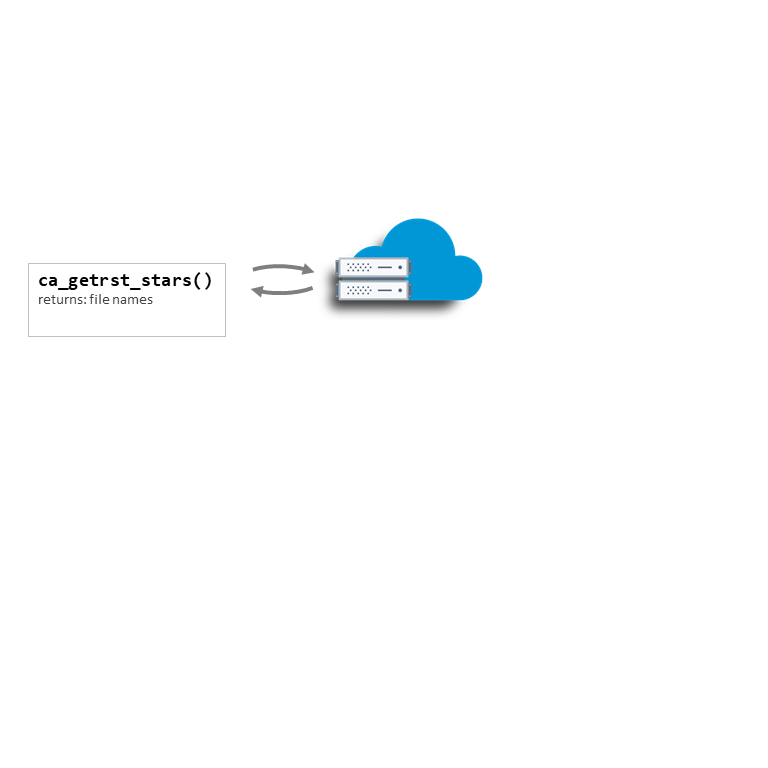
You can use the same API Request object to fetch rasters


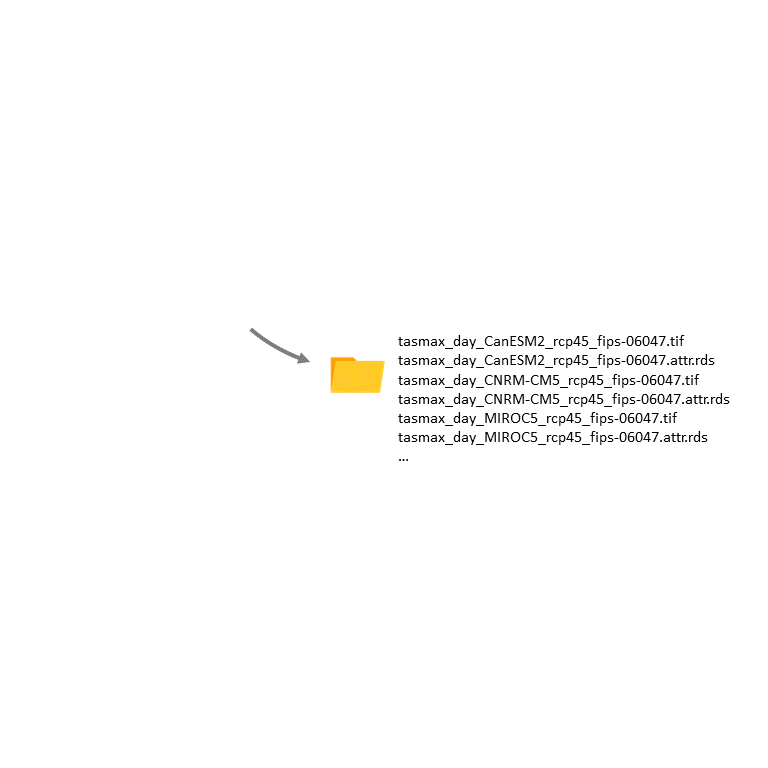
Feed the API Request into ca_getrst_stars()

  • downloads and saves TIFs to disk
  • stores raster metadata in sidecar files


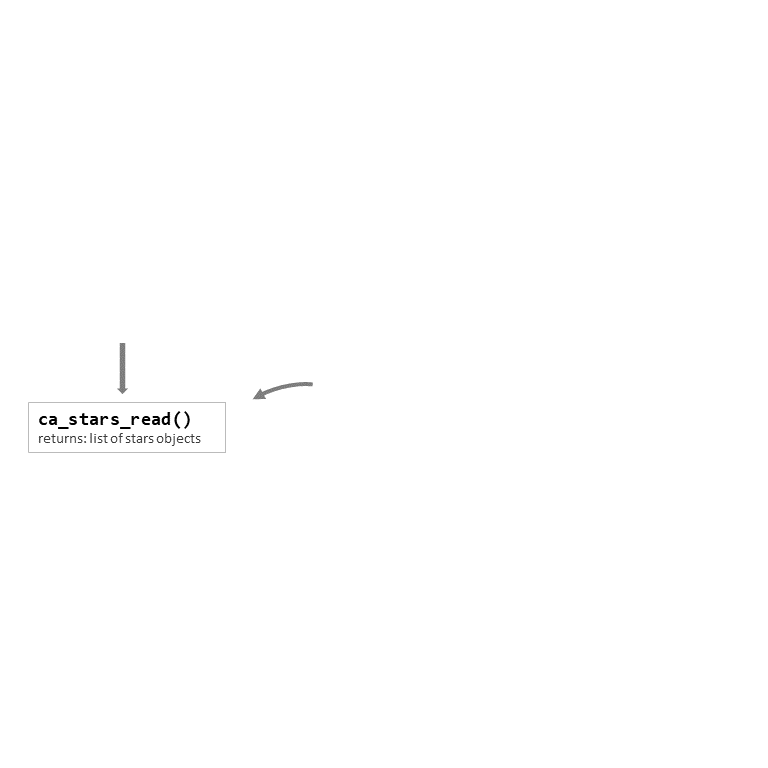
ca_read_stars() import the TIFs plus their metadata into R as stars objects


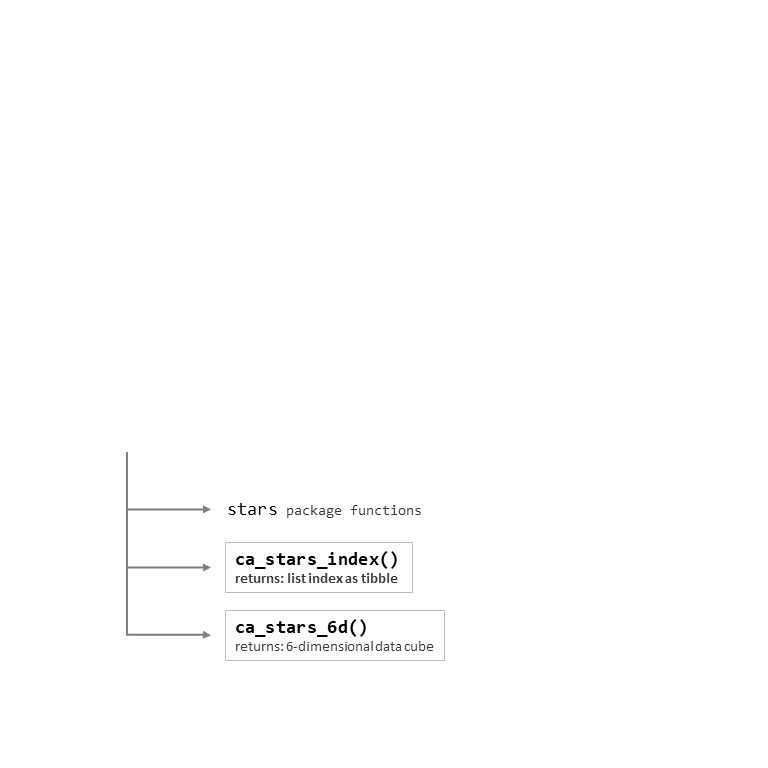
Use stars methods for analysis:

  • dplyr style filtering
  • spatial overlay / extract
  • raster algebra
  • pixelwise summaries
  • spatial manipulations
  • plotting


Convenience functions to help manage stars objects:

  • create index
  • multiple rasters → 6D array
  • mosaic


Rasters Workflow

Vignettes

Rasters Part I: Download, Combine, Subset, and Compute Pixel Summaries

Rasters Part II: Six-Dimensional Climate Data Cubes and Spatial Queries

Rasters Part III: Downloading Rasters for Large Areas

stars 101

Coming soon…

Notebook Time!

In Notebook 4 you will:

  • download climate data as stars rasters
  • extract values spatially and by dimensions
  • do pixelwise summaries
  • plot

Notebook 4. Rasters | solutions

END PART IV!