

Type of Organization
Email domain
Location
Familiarity with degree days
Familiarity with R

Programming techniques for working with weather data and degree day models in R
Degree day models are widely used to predict the development / phenology of plants and insects
They are widely used in:
Implementing degree days requires:
R is well-equipped to wrangle data, compute degree days, and make predictions
APIs have simplified importing weather data, but its still tricky
Shiny greatly simplifies developing and publishing degree days models as lightweight web apps


dplyr
dplyr Functions| subset rows | filter(), slice() |
| order rows | arrange() |
| pick column(s) | select(), pull() |
| add new columns | mutate() |
Piping allows the result of one function to be passed as the first argument of the next function.
Pipe operators:
magrittr) pipe: %>%This allows a series of functions to be written like a sentence.
zoo(moo(boo(foo(99)),n=4))


degday
dd_simp_avg()
dd_sng_sine()
dd_dbl_sine()
dd_sng_tri()
dd_dbl_tri()
Usage Notes
mutate() with one of the above functions to add a
column for daily degree daysmutate() and cumsum())
Load some sample data:
library(degday)

espartoa_tbl <- system.file("extdata/espartoa-weather-2020.csv", package = "degday") |>
  read.csv() |>
  mutate(date = as.Date(date))

head(espartoa_tbl)
## station date tmin tmax
## 1 Esparto.A 2020-01-01 38 55
## 2 Esparto.A 2020-01-02 36 67
## 3 Esparto.A 2020-01-03 33 59
## 4 Esparto.A 2020-01-04 37 59
## 5 Esparto.A 2020-01-05 38 63
## 6 Esparto.A 2020-01-06 36 58
Compute daily degree days using the single sine method, and save it as a new column:
espartoa_tbl |>
  mutate(degdays = dd_sng_sine(daily_min = tmin, daily_max = tmax,
                                thresh_low = 55, thresh_up = 93.9)) |>
  mutate(acc_degdays = cumsum(degdays)) |>
  head()
## - using single sine method## station date tmin tmax degdays acc_degdays
## 1 Esparto.A 2020-01-01 38 55 0.00 0.00
## 2 Esparto.A 2020-01-02 36 67 3.31 3.31
## 3 Esparto.A 2020-01-03 33 59 0.68 3.99
## 4 Esparto.A 2020-01-04 37 59 0.74 4.73
## 5 Esparto.A 2020-01-05 38 63 1.99 6.72
## 6 Esparto.A 2020-01-06 36 58 0.48 7.20
The double-sine and double-triangle methods require adding tomorrow’s minimum temperature as an additional column:
espartoa_plus2mrw_tbl <- espartoa_tbl |>
  mutate(tomorrow_tmin = lead(tmin, n = 1))

head(espartoa_plus2mrw_tbl)
## station date tmin tmax tomorrow_tmin
## 1 Esparto.A 2020-01-01 38 55 36
## 2 Esparto.A 2020-01-02 36 67 33
## 3 Esparto.A 2020-01-03 33 59 37
## 4 Esparto.A 2020-01-04 37 59 38
## 5 Esparto.A 2020-01-05 38 63 36
## 6 Esparto.A 2020-01-06 36 58 30
Compute daily degree days with the double-sine method:
espartoa_plus2mrw_tbl |>
  mutate(dbl_tri = dd_dbl_tri(daily_min = tmin, daily_max = tmax,
                              nextday_min = tomorrow_tmin,
                              thresh_low = 55, thresh_up = 93.9)) |>
  head()
## - using double triangle method## station date tmin tmax tomorrow_tmin dbl_tri
## 1 Esparto.A 2020-01-01 38 55 36 0.00
## 2 Esparto.A 2020-01-02 36 67 33 2.22
## 3 Esparto.A 2020-01-03 33 59 37 0.34
## 4 Esparto.A 2020-01-04 37 59 38 0.37
## 5 Esparto.A 2020-01-05 38 63 36 1.23
## 6 Esparto.A 2020-01-06 36 58 30 0.18
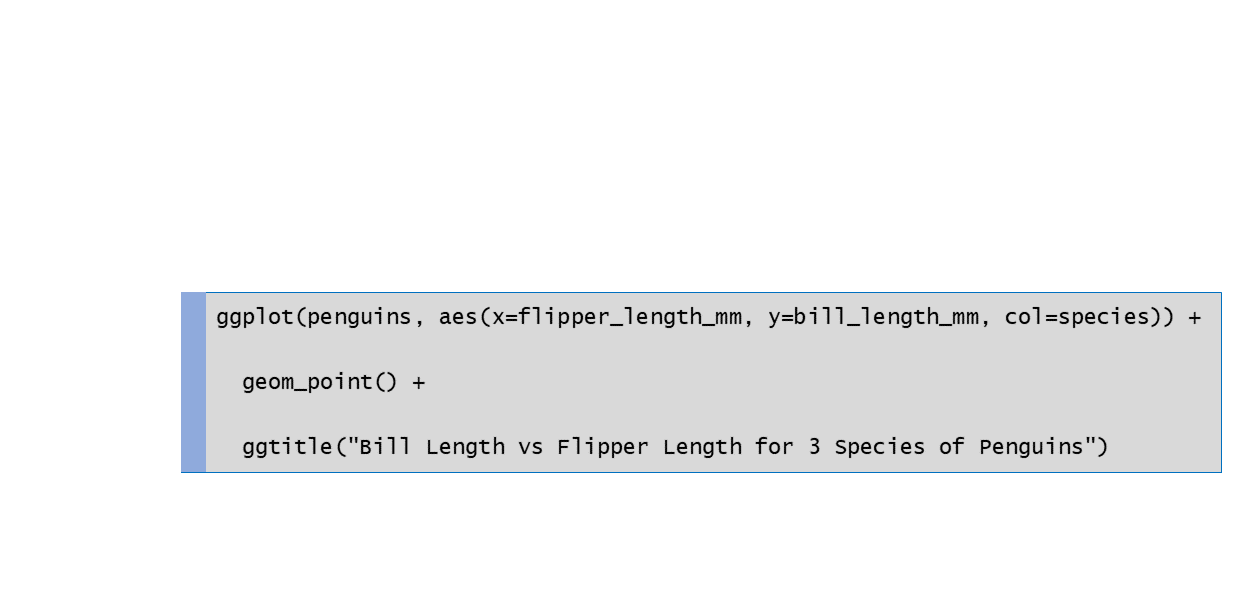
ggplotlibrary(ggplot2)
library(palmerpenguins)
ggplot(penguins, aes(x = flipper_length_mm, y = bill_length_mm, color = species)) +
geom_point() +
ggtitle("Bill Length vs Flipper Length for 3 Species of Penguins")


R Notebooks are written in “R Markdown”, which combines text and R code.
.png)
.png)
.png)
.png)
.png)
.png)
.png)
.png)
.png)
Download a RStudio project with all the exercises and data:
/scripts/install_packages.R