May
24,
2024
https://ucanr-igis.github.io/degday-shiny-s24/

degday


Working with dates in R
lubridate converting text to date-time objects, creating date-time objects from scratch time zones extracting date parts
Redo the graphic API request - server - response - table
Reading the docs
Prepare the request Base URL URL path Query Parameters Headers Body
sac_midcentury_req <- request(“https://api.cal-adapt.org/api/series”) |> req_user_agent(“oski@berkeley.edu”) |> req_url_path_append(“tasmax_year_MIROC5_rcp45/events”) |> req_url_query(g = “POINT (-121.4687 38.5938)”, start = “2040-01-01”, end = “2070-12-31”)
sac_midcentury_resp <- sac_midcentury_req |> req_perform()
sac_midcentury_resp |> resp_status_desc()
sac_midcentury_lst <- sac_midcentury_resp |> resp_body_json()
View(sac_midcentury_lst)
Protecting your API token
API Etiquette
Exercise: Synoptic Data
if there’s time
Show a graph of degree days varieties over time: single-sine, double-sine (put this in part I)
No API key is required:
R package:

Downscaled modeled climate data for western USA (1950 - 2099)
Gridded observed data: Livneh and gridMet

https://ucanr-igis.github.io/caladaptr/
First, make sure the date column is actually contains Date objects
(or POSIXct for date-time values), as opposed to text:
espartoa_tbl <- system.file("extdata/espartoa-weather-2020.csv", package = "degday") |>
  read.csv() |>
  mutate(date = as.Date(date))

espartoa_tbl |> head()
## station date tmin tmax
## 1 Esparto.A 2020-01-01 38 55
## 2 Esparto.A 2020-01-02 36 67
## 3 Esparto.A 2020-01-03 33 59
## 4 Esparto.A 2020-01-04 37 59
## 5 Esparto.A 2020-01-05 38 63
## 6 Esparto.A 2020-01-06 36 58## [1] "Date"
Filtering a data frame based on the date can be with
dplyr::filter(). Just make sure the comparison values are
also dates.
For example, we can extract the values between St Patrick’s Day and Tax Day (April 15) in 2020:
##      station       date tmin tmax
## 1  Esparto.A 2020-03-17   41   55
## 2  Esparto.A 2020-03-18   43   53
## 3  Esparto.A 2020-03-19   36   61
## 4  Esparto.A 2020-03-20   35   64
## 5  Esparto.A 2020-03-21   39   66
## 6  Esparto.A 2020-03-22   40   69
## 7  Esparto.A 2020-03-23   45   65
## 8  Esparto.A 2020-03-24   40   58
## 9  Esparto.A 2020-03-25   36   57
## 10 Esparto.A 2020-03-26   34   61
## 11 Esparto.A 2020-03-27   35   63
## 12 Esparto.A 2020-03-28   46   58
## 13 Esparto.A 2020-03-29   46   62
## 14 Esparto.A 2020-03-30   45   67
## 15 Esparto.A 2020-03-31   52   72
## 16 Esparto.A 2020-04-01   46   66
## 17 Esparto.A 2020-04-02   46   69
## 18 Esparto.A 2020-04-03   40   67
## 19 Esparto.A 2020-04-04   42   57
## 20 Esparto.A 2020-04-05   45   56
## 21 Esparto.A 2020-04-06   40   59
## 22 Esparto.A 2020-04-07   42   66
## 23 Esparto.A 2020-04-08   44   64
## 24 Esparto.A 2020-04-09   49   64
## 25 Esparto.A 2020-04-10   51   73
## 26 Esparto.A 2020-04-11   47   72
## 27 Esparto.A 2020-04-12   47   75
## 28 Esparto.A 2020-04-13   48   77
## 29 Esparto.A 2020-04-14   51   80
## 30 Esparto.A 2020-04-15   43   81
Extract the in June, July, and August:
##      station       date tmin tmax
## 1  Esparto.A 2020-06-01   60   86
## 2  Esparto.A 2020-06-02   60   95
## 3  Esparto.A 2020-06-03   63  100
## 4  Esparto.A 2020-06-04   60   98
## 5  Esparto.A 2020-06-05   58   82
## 6  Esparto.A 2020-06-06   58   78
## 7  Esparto.A 2020-06-07   57   88
## 8  Esparto.A 2020-06-08   58   83
## 9  Esparto.A 2020-06-09   55   90
## 10 Esparto.A 2020-06-10   63   96
## 11 Esparto.A 2020-06-11   59   93
## 12 Esparto.A 2020-06-12   58   76
## 13 Esparto.A 2020-06-13   55   77
## 14 Esparto.A 2020-06-14   59   84
## 15 Esparto.A 2020-06-15   65   85
## 16 Esparto.A 2020-06-16   60   81
## 17 Esparto.A 2020-06-17   64   87
## 18 Esparto.A 2020-06-18   59   94
## 19 Esparto.A 2020-06-19   58   96
## 20 Esparto.A 2020-06-20   56   91
## 21 Esparto.A 2020-06-21   59   93
## 22 Esparto.A 2020-06-22   59   99
## 23 Esparto.A 2020-06-23   64   98
## 24 Esparto.A 2020-06-24   62   99
## 25 Esparto.A 2020-06-25   60   95
## 26 Esparto.A 2020-06-26   59   95
## 27 Esparto.A 2020-06-27   60   95
## 28 Esparto.A 2020-06-28   59   87
## 29 Esparto.A 2020-06-29   65   88
## 30 Esparto.A 2020-06-30   60   91
## 31 Esparto.A 2020-07-01   55   92
## 32 Esparto.A 2020-07-02   55   88
## 33 Esparto.A 2020-07-03   62   96
## 34 Esparto.A 2020-07-04   53   93
## 35 Esparto.A 2020-07-05   58   95
## 36 Esparto.A 2020-07-06   56   90
## 37 Esparto.A 2020-07-07   53   89
## 38 Esparto.A 2020-07-08   65   94
## 39 Esparto.A 2020-07-09   61   98
## 40 Esparto.A 2020-07-10   60   98
## 41 Esparto.A 2020-07-11   59  103
## 42 Esparto.A 2020-07-12   59  101
## 43 Esparto.A 2020-07-13   61   92
## 44 Esparto.A 2020-07-14   58   92
## 45 Esparto.A 2020-07-15   58   96
## 46 Esparto.A 2020-07-16   62   94
## 47 Esparto.A 2020-07-17   61   93
## 48 Esparto.A 2020-07-18   60   96
## 49 Esparto.A 2020-07-19   61   97
## 50 Esparto.A 2020-07-20   60   96
## 51 Esparto.A 2020-07-21   59   93
## 52 Esparto.A 2020-07-22   60   96
## 53 Esparto.A 2020-07-23   56   94
## 54 Esparto.A 2020-07-24   58   94
## 55 Esparto.A 2020-07-25   55   95
## 56 Esparto.A 2020-07-26   60  100
## 57 Esparto.A 2020-07-27   61  101
## 58 Esparto.A 2020-07-28   59  100
## 59 Esparto.A 2020-07-29   60   96
## 60 Esparto.A 2020-07-30   60   96
## 61 Esparto.A 2020-07-31   52   97
## 62 Esparto.A 2020-08-01   53   94
## 63 Esparto.A 2020-08-02   58   98
## 64 Esparto.A 2020-08-03   60   99
## 65 Esparto.A 2020-08-04   58   95
## 66 Esparto.A 2020-08-05   59   95
## 67 Esparto.A 2020-08-06   56   90
## 68 Esparto.A 2020-08-07   61   96
## 69 Esparto.A 2020-08-08   62   95
## 70 Esparto.A 2020-08-09   62   98
## 71 Esparto.A 2020-08-10   64   99
## 72 Esparto.A 2020-08-11   61   93
## 73 Esparto.A 2020-08-12   57   97
## 74 Esparto.A 2020-08-13   60   97
## 75 Esparto.A 2020-08-14   71  103
## 76 Esparto.A 2020-08-15   68  107
## 77 Esparto.A 2020-08-16   60   96
## 78 Esparto.A 2020-08-17   59   95
## 79 Esparto.A 2020-08-18   71  102
## 80 Esparto.A 2020-08-19   71   97
## 81 Esparto.A 2020-08-20   62   85
## 82 Esparto.A 2020-08-21   59   91
## 83 Esparto.A 2020-08-22   67   97
## 84 Esparto.A 2020-08-23   61   97
## 85 Esparto.A 2020-08-24   67   96
## 86 Esparto.A 2020-08-25   58   94
## 87 Esparto.A 2020-08-26   58   95
## 88 Esparto.A 2020-08-27   54   92
## 89 Esparto.A 2020-08-28   59   94
## 90 Esparto.A 2020-08-29   61   94
## 91 Esparto.A 2020-08-30   60   91
## 92 Esparto.A 2020-08-31   60   96
The standard way to resample involves group_by()
followed by summarise().
FOr example to resample by month:
espartoa_tbl |>
  mutate(month = month(date)) |>
  group_by(month) |>
  summarise(tmin_mean = mean(tmin), tmax_mean = mean(tmax), .groups = "drop")
## # A tibble: 12 × 3
## month tmin_mean tmax_mean
## <dbl> <dbl> <dbl>
## 1 1 39.3 58.4
## 2 2 41.1 68.0
## 3 3 41.9 64.5
## 4 4 49.3 74.5
## 5 5 54.1 83.5
## 6 6 59.7 90
## 7 7 58.6 95.3
## 8 8 61.2 95.7
## 9 9 58.1 91.0
## 10 10 50.7 84.6
## 11 11 39.1 66.9
## 12 12 37.6 58.9
Often you have to “build up” a table thru multiple API calls.
A common way to do this is thru a loop. (For large data, consider also appending to a database).)
my_master_weather_tbl <- NULL

for (i in <something or other>) {
  one_bunch_of_data_tbl <- tibble(...)
  my_master_weather_tbl <- bind_rows(my_master_weather_tbl, one_bunch_of_data)
}

my_master_weather_tbl    ## Contains everything!!
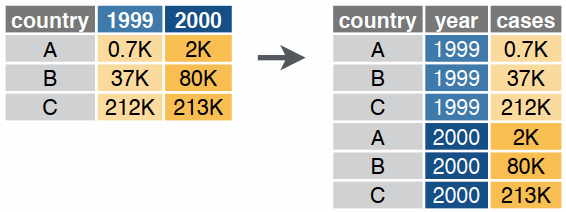
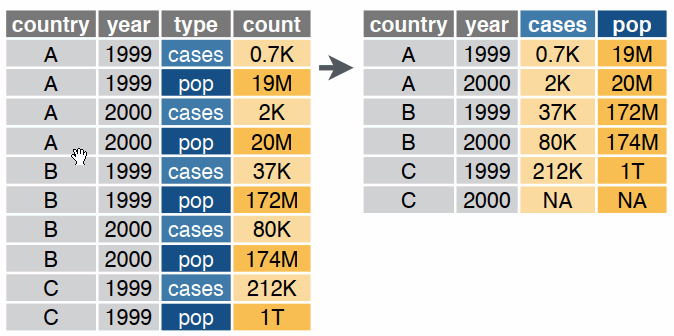
Reshaping data includes:
The go-to Tidyverse package for reshaping data frames is tidyr
pivot_longer()

pivot_wider()

More info and examples in the tidyr Pivoting Vignette
Click ‘Save a permanent copy’
Done!
Download a RStudio project with all the exercises and data:
/scripts/install_packages.R
Provide useful information in useful ways
Do no harm
Be transparent about:
