Spatial Data Analysis with R
Society for Conservation GIS, July 2021
Foundatational GIS Concepts 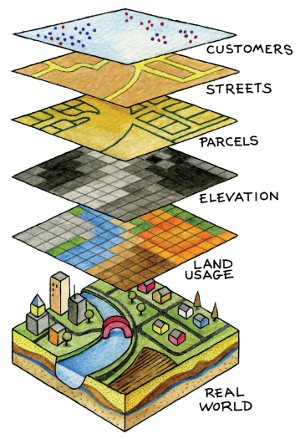
Foundatational GIS Concepts
Start by chopping up the real world into different “layers” with similar features:

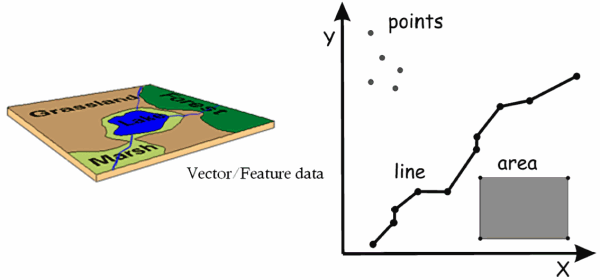
Option 1 is to represent features as “vectors” (points, lines and polygons):
Option 2 is to represent features as a grid or “raster”:

How do we squish a round planet onto flat maps?
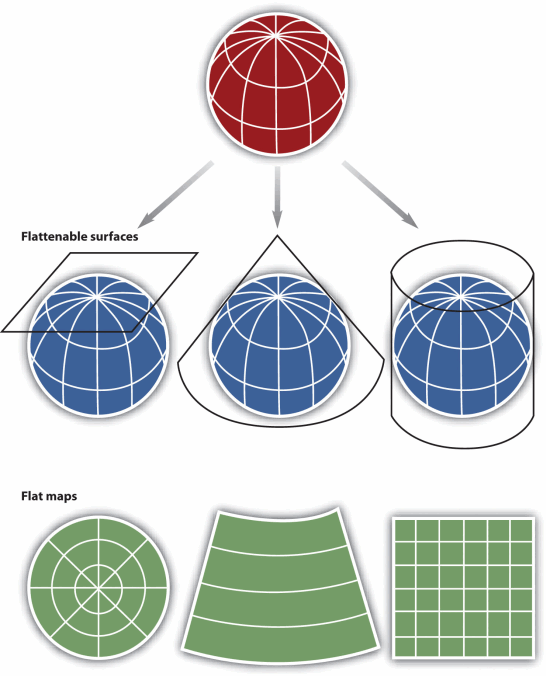
A common projection system is Universal Transverse Mercator (UTM). UTM divides the planet up into 60 zones that are 6 degrees wide. The USA falls in zones 10-19.

sf package can read & write projection info when importing or exporting GIS filesst_transform())Every feature has some additional, non-spatial properties, typically called attributes.

Attributes are used for:

Landsat infrared image (false-color-composite)

Elevation (measured from Shuttle)
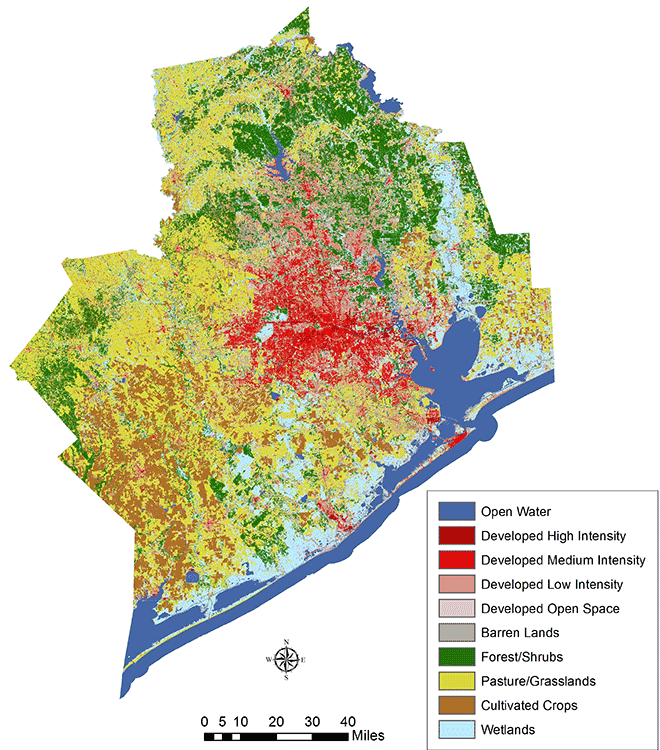
Land cover map (derived from satellite image)
Distance to trails (computed)
Rasters with multiple layers are common in multi-spectral data (e.g., Landsat). Each band saves the reflectance in a different part of the electromagnetic spectrum.
![]()
Whether saved as separate RasterLayer objects, or a single multi-layered RasterStack or RasterBrick, up to three layers can be combined to produce colors when plotting.

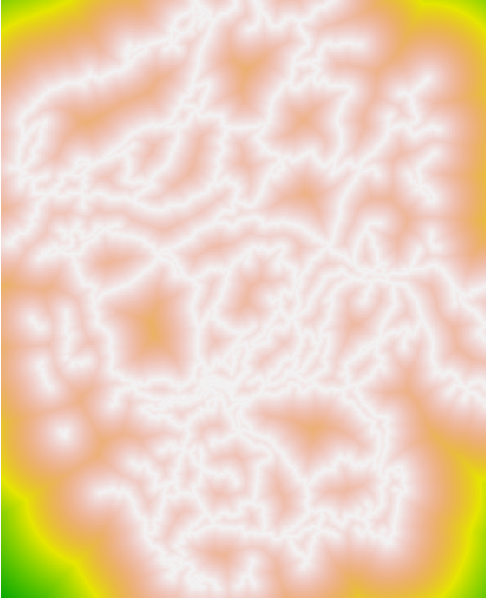
Cell values can be either continuous or discrete.
Continuous

Discrete / Categorical
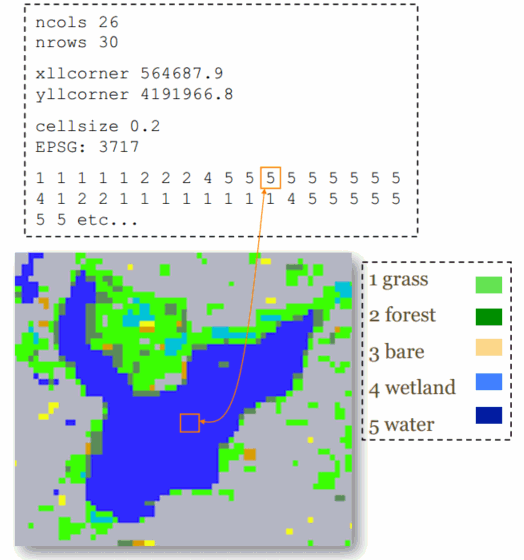
Discrete rasters also have a ‘Raster Attribute Table’ (RAT), which stores the name of each category.
Rasters vs. Tiles
Rasters are data you can visualize and manipulate.
Tiles are background images you get from online providers for display purposes. They look nice, but what you see is what you get (no ability to manipulate).
Continuous or Discrete?
How would you represent each of the following surfaces - continuous or discrete?