It’s usually saved a folder with other stuff needed (e.g., data).
But app.R is not a typical R script…
Traditional R Script
## Load librarieslibrary(sf)library(dplyr)library(units)library(arcgisbinding)## Initialize R-ArcGIS Bindingarc.check_product()## Create a tibble with the correct names and abbreviationsrec_abbrev_tbl <-c("Desert", "DREC","Hansen", "HAREC","Hopland", "HREC","Intermountain", "IREC","Kearney", "KARE","Lindcove", "LREC","Sierra Foothill", "SFREC","South Coast", "SCREC","Westside", "WSREC") |>matrix(ncol =2, byrow =TRUE) |>as_tibble() |>setNames(c("name", "abbrev"))## Get the feature layer for the REC boundariesrecs_bnd_url <-"https://geodata.ucanr.edu/arcgis/rest/services/REC_Data/FeatureServer/0"## Import and fix errors in the attribute table recs_bnd_sf <- recs_bnd_url |>arc.open() |>arc.select() |>arc.data2sf() |>st_zm() |>st_transform(3857) |>select(name, brochure_l) |>group_by(name) |>summarise(name =first(name),brochure =first(brochure_l)) |>mutate(objectid =row_number()) |>mutate(acres =st_area(geom) |>set_units(acres) |>round(1) |>as.numeric()) |>mutate(name =if_else(name =="HREC","Hopland", name)) |>left_join(rec_abbrev_tbl, by ="name") |>relocate(objectid, name, abbrev, acres, brochure, geom)## Export polygonsrecs_bnd_sf |>st_write(dsn =file.path(data_dir, "recs_bnd_3857_v3.geojson"), delete_dsn =TRUE) ## Export centroidsrecs_bnd_sf |>st_centroid() |>st_write(dsn =file.path(data_dir, "recs_ctr_3857_v3.geojson"),delete_dsn =TRUE)
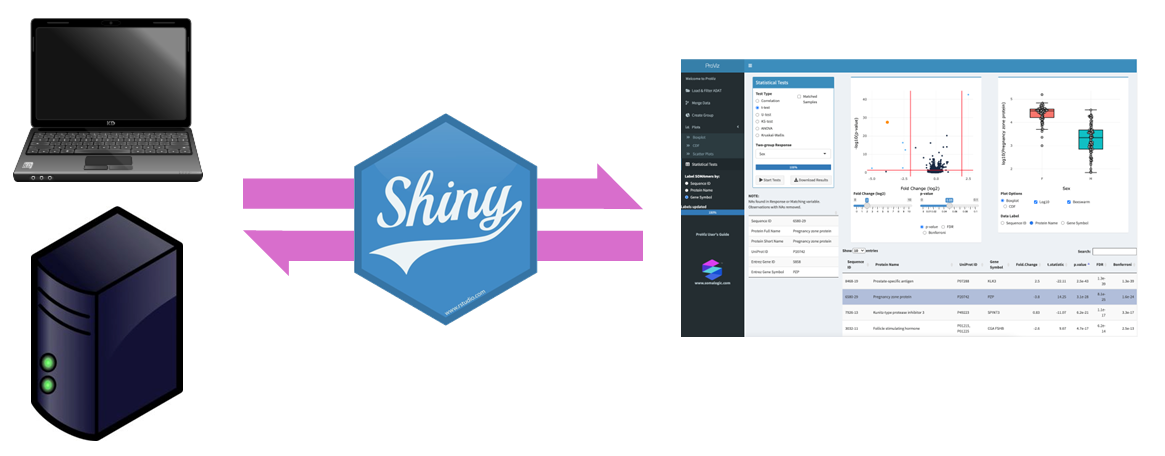
Programming for Web Apps
Shiny Server
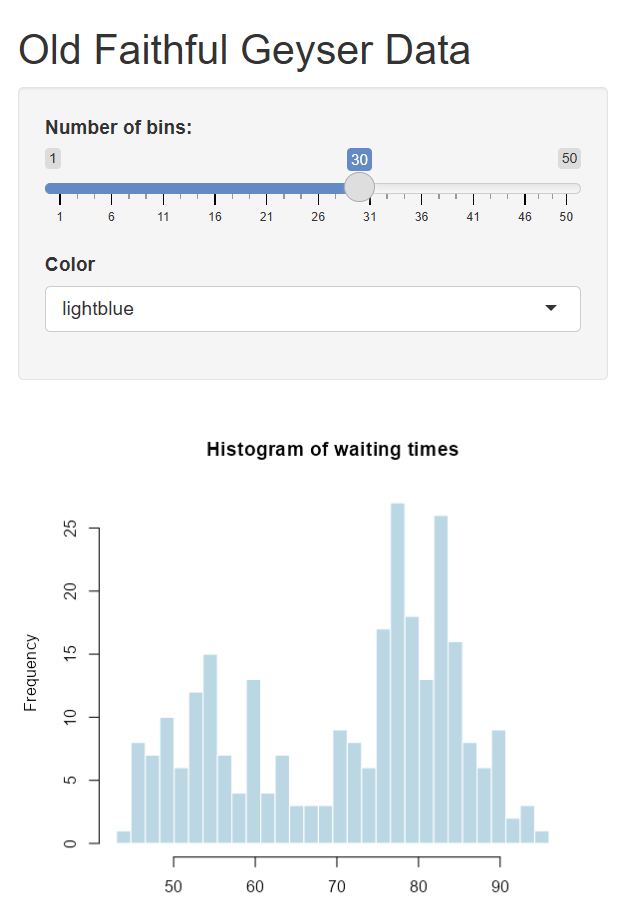
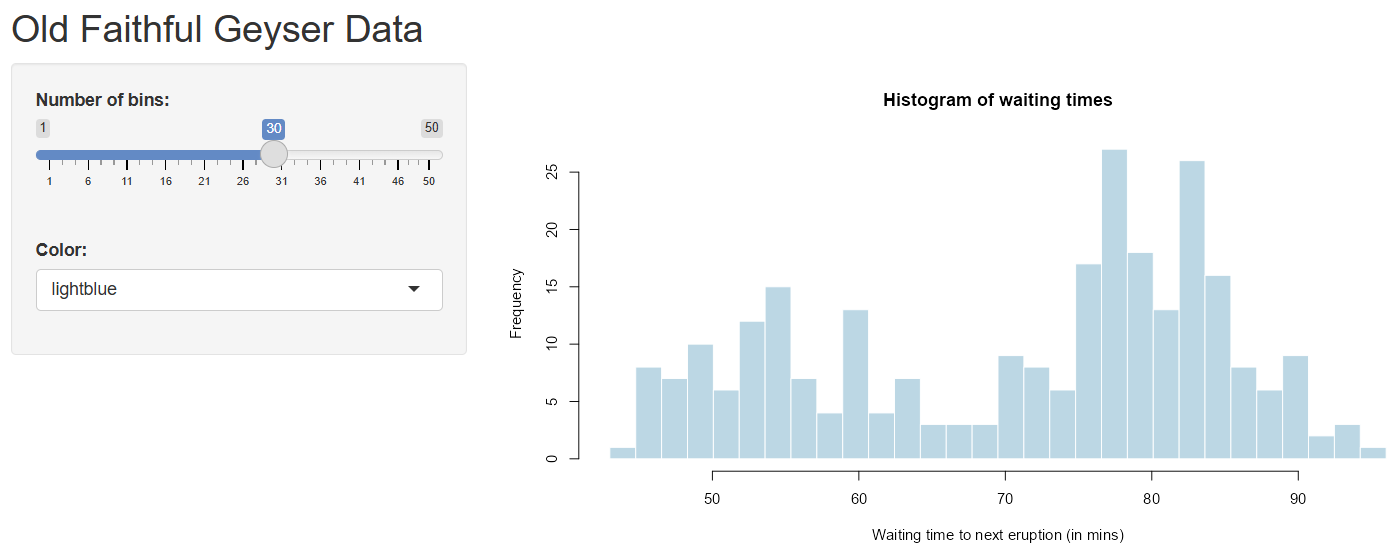
Anatomy of app.R
# Preamble - load library, import data, etc.library(shiny)# Define UI elements, layoutui <-fluidPage(titlePanel("Old Faithful Geyser Data"),sidebarLayout(sidebarPanel(sliderInput("bins", "Number of bins:", min =1, max =50, value =30)),mainPanel(plotOutput("distPlot") ) ))# Define server logic server <-function(input, output) { output$distPlot <-renderPlot({ x <- faithful[, 2] bins <-seq(min(x), max(x), length.out = input$bins +1)hist(x, breaks = bins, col ='darkgray', border ='white',xlab ='Waiting time to next eruption (in mins)') })}# Run the appshinyApp(ui = ui, server = server)
Your New Best Friend: HTML & CSS
When programming in Shiny, you have a powerful ally: HTML & CSS
shiny & htmltools have dozens of functions that produce HTML code.
Example:
tags$p("For more info, go to our ", tags$a("web page", href ="https://igis.ucanr.edu/"), ".")
generates:
<p>For more info, go to our <a href="https://igis.ucanr.edu/">web page</a>.</p>
output$out_num_hurricanes <-renderText({## renderText expects a character object## You can have a 100 lines of code if needed category3_hurricanes <- storms |>filter(category ==3) |>distinct(name, year)## As long as the last one returns a character object!nrow(category3_hurricanes) |>as.character()})
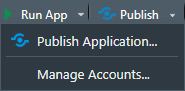
The shinylive package can convert your Shiny app to a version of R that runs in the browser so doesn’t require Shiny Server. This allows you to host it on a standard web server!